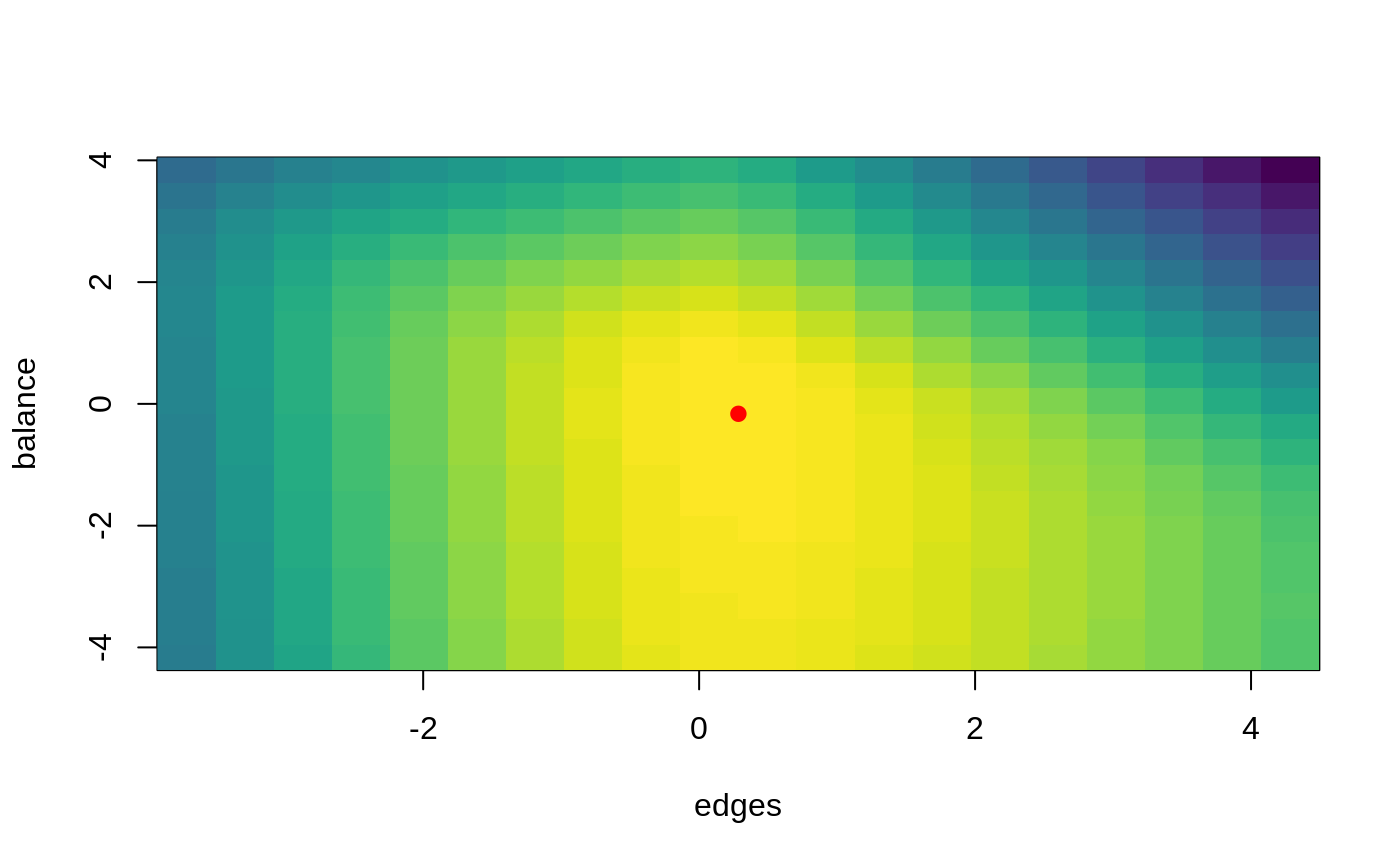
General diagnostics function. This function allows to visualize the surface to be maximize at around a particular point.
# S3 method for ergmito
plot(
  x,
  y = NULL,
  domain = NULL,
  plot. = TRUE,
  par_args = list(),
  image_args = list(),
  breaks = 20L,
  extension = 4L,
  params_labs = stats::setNames(names(coef(x)), names(coef(x))),
  ...
)
Arguments
| x | An object of class ergmito. |
|---|---|
| y, ... | Ignored. |
| domain | A list. |
| plot. | Logical. When |
| par_args | Further arguments to be passed to graphics::par |
| image_args | Further arguments to be passed to graphics::image |
| breaks | Integer scalar. Number of splits per dimension. |
| extension | Numeric. Range value of the function. |
| params_labs | Named vector. Alternative labels for the parameters. It
should be in the form of |
Value
A list of length choose(length(object$coef), 2) (all possible
combinations of pairs of parameters), each with the following elements:
zA matrixzA vectoryA vectorxlabA string. Name of the ERGM parameter in the x-axis.ylabA string. Name of the ERGM parameter in the y-axis.
The list is returned invisible.
Details
It calculates the surface coordinates for each pair of parameters included in the ERGMito.
See also
The ergmito function.
Examples
#> Warning: The observed statistics (target.statistics) are near or at the boundary of its support, i.e. the Maximum Likelihood Estimates maynot exist or be hard to be estimated. In particular, the statistic(s) "edges", "balance".plot(ans)